
Read heat pipe thermal conductivity by checking the heat flow, temperature difference, length and area convention behind each stated value. It is a useful modeling quantity when those conventions are stated. An engineer comparing quotations may find large numbers with no sensor positions or cross-sectional area attached. Ask for the measured resistance and test boundaries alongside conductivity, so your model represents the proposed assembly at its intended operating point.
1. What does heat pipe thermal conductivity describe?
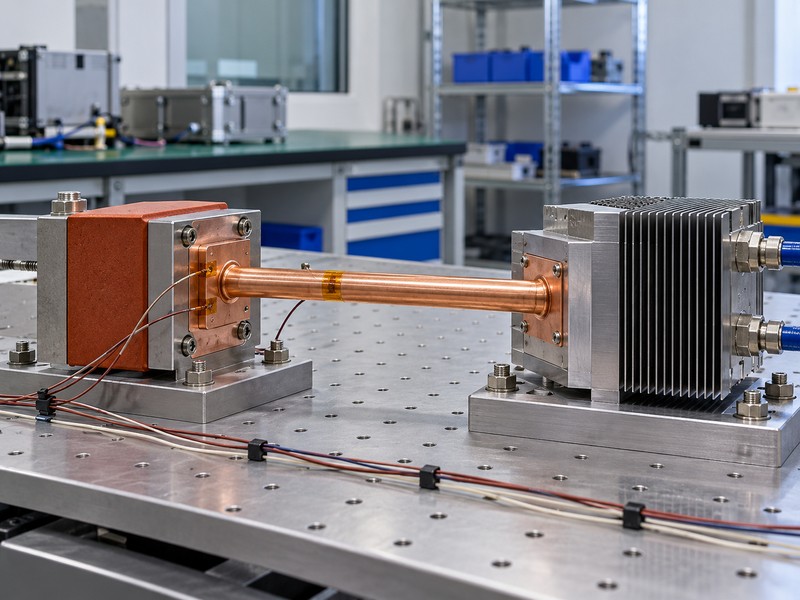
Heat pipe thermal conductivity describes an equivalent conduction performance assigned to a two-phase device under stated conditions. A heat pipe moves energy through wall conduction, evaporation, vapor flow, condensation, and liquid return. An equivalent conductivity compresses that behavior into a convenient relationship between heat flow and temperature difference. It does not turn the assembly into a homogeneous solid with a fixed material property.
Why does the word effective belong in the report?
For a solid material, conductivity is specified with material condition and temperature. For a heat pipe, the reported effective value also depends on selected length, area, power, orientation, and measurement boundaries. Two laboratories can obtain different values from the same device if they choose different definitions. Preserve the definitions when transferring a number into a spreadsheet or simulation.
- Identify the exact device and formed drawing.
- State operating temperature, load, and orientation.
- Record the geometric and sensor conventions.
| Reported quantity | What it describes |
|---|---|
| Material conductivity | A material’s conduction response |
| Effective conductivity | A defined device-equivalent response |
| Thermal resistance | Temperature difference per transported power |
Treat an effective value as a documented operating-point result that travels with its definitions and test conditions.
2. How do you calculate the effective value?
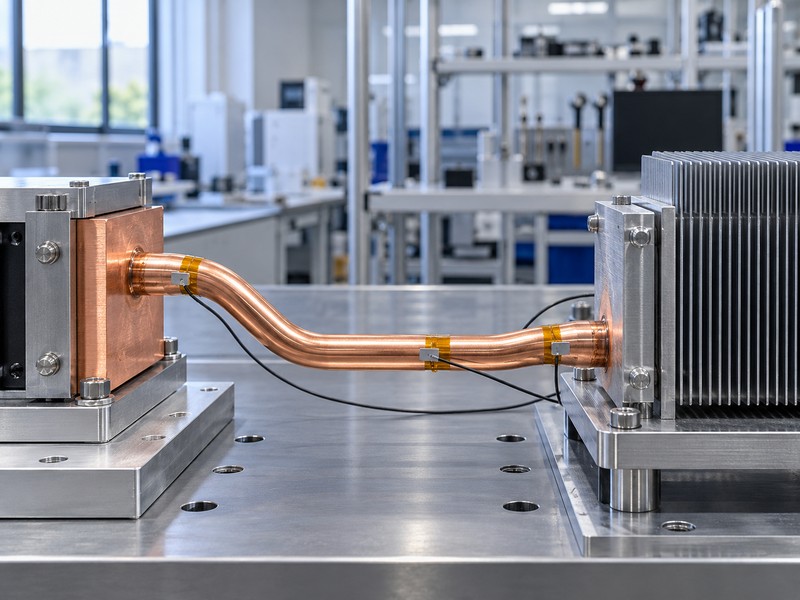
Calculate heat pipe thermal conductivity using k_eff = Q × L_eff / (A_ref × ΔT), with each term defined consistently. Here Q is transported heat in watts, L_eff is the chosen effective length in metres, A_ref is the declared reference cross-sectional area in square metres, and ΔT is the corresponding evaporator-to-condenser temperature difference in kelvins. The resulting unit is W/(m·K).
How does resistance simplify the comparison?
For the same temperature boundaries and heat flow, thermal resistance is R = ΔT / Q in K/W. Rearranging gives k_eff = L_eff / (A_ref × R). Reporting resistance makes the actual measured temperature penalty easier to see without hiding it behind a geometric multiplier. Resistance still needs the operating conditions and sensor boundaries because heat pipe behavior changes with them.
- Use metres and square metres in the calculation.
- Use net transported heat rather than uncorrected input power.
- Keep the same temperature definition in both equations.
| Symbol | Required definition |
|---|---|
| Q | Net heat through the defined device boundary |
| L_eff | Declared effective transport length |
| A_ref | Declared reference area |
| ΔT | Defined hot-to-cold temperature difference |
Request these four inputs before accepting a quoted effective conductivity as a useful design parameter.
3. Which length should enter the equation?
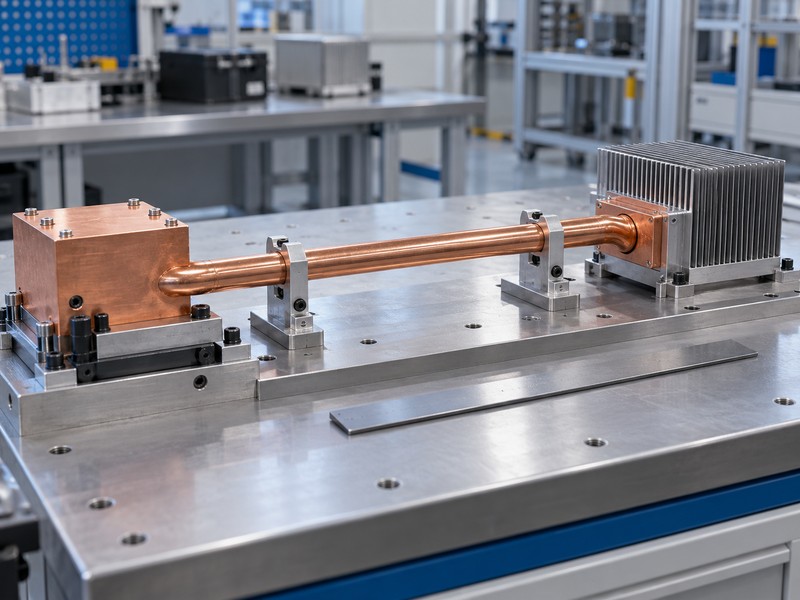
A commonly used heat pipe thermal conductivity convention uses L_eff = L_adiabatic + (L_evaporator + L_condenser) / 2. This approximates the distance between the centers of distributed heat input and heat rejection. It differs from the overall tip-to-tip pipe length. The convention is useful when the contact distribution and measurement boundary support it, but it should not replace a different explicitly defined model geometry without reconciliation.
What changes with distributed or uneven contacts?
An assembly may heat several separated pipe regions or reject heat through an uneven condenser attachment. In that case, a simple midpoint distance may poorly describe the thermal path. Show actual contact zones and sensor positions on a drawing. If your simulation requires an end-to-end equivalent solid, derive the input for that domain and verify it against the measured temperatures.
- Distinguish overall length from effective transport length.
- Record all heated and cooled contact lengths.
- Identify gaps or uneven source loading.
| Length description | Meaning |
|---|---|
| Overall length | Full physical pipe envelope |
| Adiabatic length | Region between intended heated and cooled zones |
| Effective length | Chosen distance used in the equivalent model |
Carry the length convention into your model notes so an attractive conductivity number cannot conceal a mismatched thermal domain.
4. Which cross-sectional area should you use?
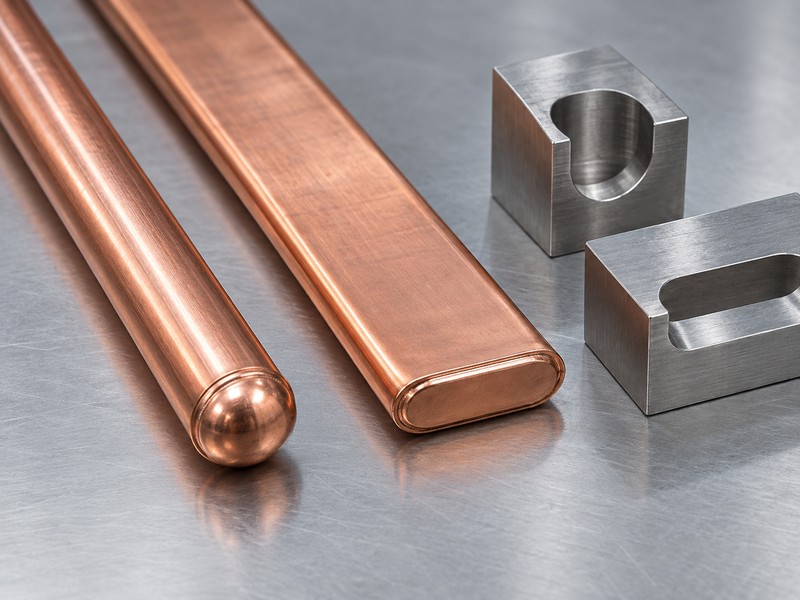
Use an explicitly declared reference area for heat pipe thermal conductivity because the equation scales inversely with that area. An external circular envelope area is one possible convention for a round pipe. Vapor-core area, metal wall area, or a flattened external area give different numerical results. None can be substituted silently when comparing reports or assigning a value to a modeled solid.
How does area create a misleading ranking?
If two calculations use identical heat flow, length, and temperature difference, doubling the reference area halves the reported effective conductivity. The physical transport performance has not changed. A vapor chamber also needs geometry-specific treatment because it spreads heat across a broad planar domain. Comparing its scalar value with a pipe’s axial value can hide the difference in heat-flow direction.
- State whether area includes the entire external envelope.
- Measure the finished shape after flattening.
- Define how multiple parallel pipes enter the model.
| Area convention | Comparison requirement |
|---|---|
| External envelope | Match external geometry |
| Vapor core | Obtain the actual internal dimensions |
| Equivalent assembly domain | Match the modeled volume and direction |
Compare temperature rise and resistance at matched boundaries before ranking devices whose conductivity calculations use different areas.
5. What does a worked calculation look like?
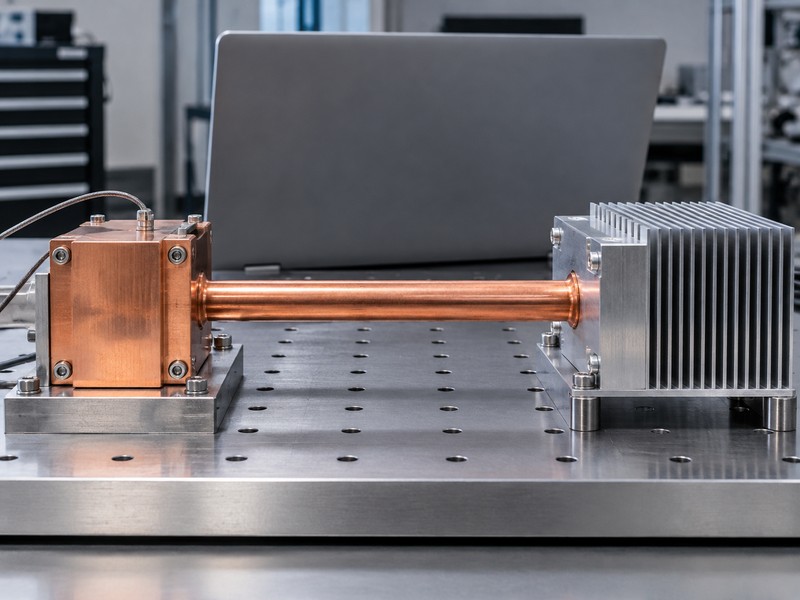
A worked heat pipe thermal conductivity calculation should declare its assumptions before presenting a result. For this hypothetical example only, assume a round pipe with a 6 mm external diameter, 30 mm evaporator contact, 50 mm condenser contact, and 80 mm adiabatic length. Assume steady net transported heat of 40 W and a defined average wall-temperature difference of 4 K. These values are illustrative, not a product rating or test result.
What follows from those assumptions?
Using the external circular envelope gives A_ref = π × 0.006² / 4 = 2.827 × 10⁻⁵ m². The midpoint convention gives L_eff = 0.080 + (0.030 + 0.050) / 2 = 0.120 m. Resistance is 4 / 40 = 0.10 K/W, and effective conductivity is approximately 42,400 W/(m·K). Both results describe the same assumed operating point and temperature boundary.
- Keep the external-area convention beside the answer.
- Retain the assumed load and wall-temperature definition.
- Avoid assigning this value to another pipe geometry.
| Hypothetical result | Calculated value |
|---|---|
| Effective length | 0.120 m |
| Thermal resistance | 0.10 K/W |
| Effective conductivity | Approximately 42,400 W/(m·K) |
Use the calculation as a reporting template and replace every assumed input with the corresponding measured or approved value.
6. Why does the value change with operating conditions?
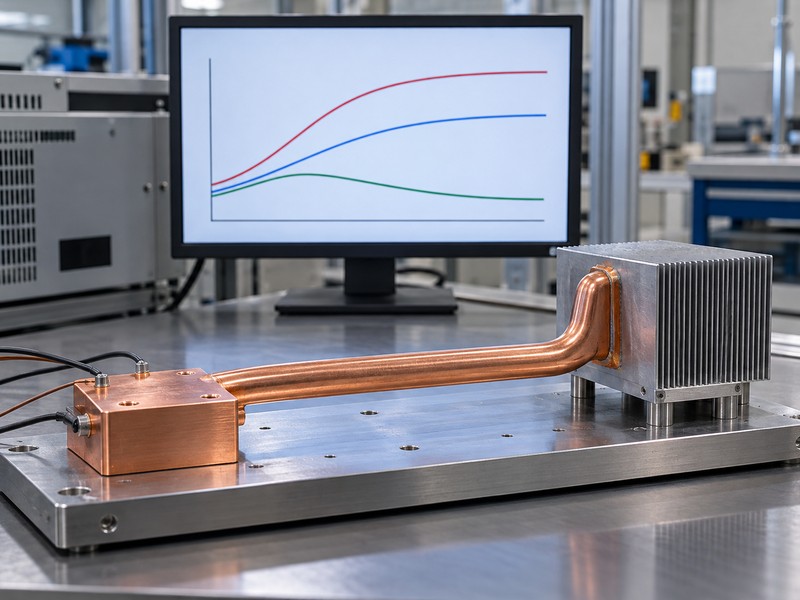
Heat pipe thermal conductivity changes because two-phase resistance depends on operating temperature, applied load, fluid circulation, and geometry. A longer device can show a larger calculated effective value because length appears in the numerator, even when its temperature penalty has not improved. That algebraic effect does not prove that extending a pipe always improves transport. Additional length also affects pressure losses and operating limits.
Which operating points belong in a useful data set?
Request results across the temperatures, loads, and orientations the equipment will use. Low-load startup behavior may differ from the settled behavior at normal power. A single fitted number can miss local dryout or a rapid temperature rise near a transport limit. Preserve the underlying temperature difference and power data rather than publishing only the calculated conductivity curve.
- Include startup and minimum operating load where relevant.
- Separate tested points from interpolated model inputs.
- Identify the validated range of any fitted relationship.
| Changed condition | Possible effect |
|---|---|
| Operating temperature | Changes fluid properties and circulation behavior |
| Heat input | Changes evaporation and pressure losses |
| Orientation | Changes liquid-return pressure requirements |
Use operating-point data over the required envelope instead of assuming one effective value remains valid throughout operation.
7. How should you measure temperatures and heat flow?
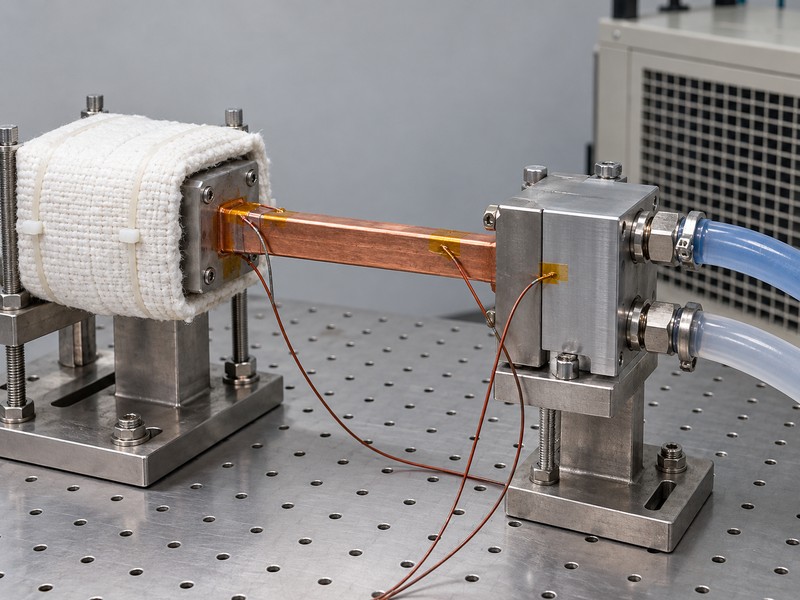
Measure heat pipe thermal conductivity with defined sensor positions, controlled thermal boundaries, and an estimate of heat that bypasses the intended path. Heater electrical power can exceed heat entering the pipe because insulation, wiring, fixtures, and surrounding air carry losses. A condenser energy balance can provide another check, provided its own losses and measurement uncertainty are addressed. Record the correction method with the result.
Which contact details can distort the measurement?
Sensors attached to heater and cold blocks include different contact losses from sensors attached to the pipe wall. State whether temperatures are local readings or averages across each contact region. Control the heater attachment and the condenser contact pressure with suitable mounting hardware. If thermal pads enter the fixture, record their compressed thickness because the measured boundary may include their resistance.
- Document calibration and sensor attachment methods.
- Insulate intended adiabatic regions and estimate residual losses.
- Apply a stated steady-state acceptance criterion.
| Measurement item | Report detail |
|---|---|
| Temperature | Positions, attachment, and averaging |
| Heat flow | Net value and loss correction |
| Contacts | Interface materials and applied mounting conditions |
Compare fixtures only after confirming which resistances each temperature measurement includes and how each setup accounts for parasitic heat flow.
8. Does high conductivity mean high transport capacity?
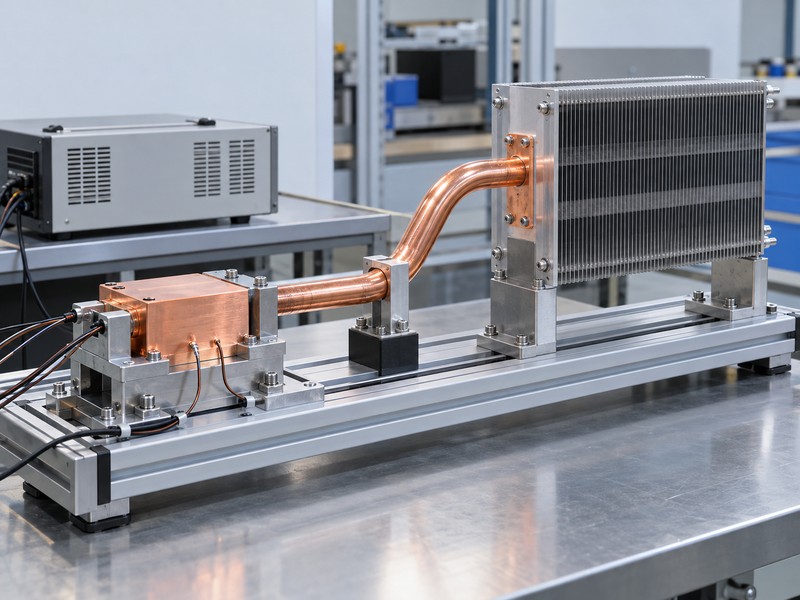
High effective heat pipe thermal conductivity does not establish the maximum heat transport capability of a device. Conductivity describes temperature difference at a stated operating point and chosen geometry. Transport limits describe conditions beyond which the intended two-phase operation cannot be maintained adequately. Capillary, boiling, entrainment, sonic, and other limits depend on construction and operating conditions; they do not collapse into one universal wattage threshold.
How should capacity and resistance be reported together?
Ask for resistance versus applied load and the criterion used to define an operating limit. The maximum permitted source temperature may become the practical equipment limit before a device reaches an internal transport limit. Conversely, a low resistance measured at moderate power cannot prove adequate margin at a much higher load. Include the cooling boundary because the condenser must reject the transported energy.
- Identify the physical or application limit being reported.
- Preserve temperature histories through load increments.
- Specify required operating margin and acceptance conditions.
| Report item | Question it answers |
|---|---|
| Resistance at a load | What temperature penalty occurs here? |
| Transport limit | Where does intended transport become constrained? |
| Equipment temperature limit | Does the installed design remain acceptable? |
Select the device using both temperature rise and transport margin at the required load, temperature, geometry, and orientation.
9. How do you use the result in simulation?
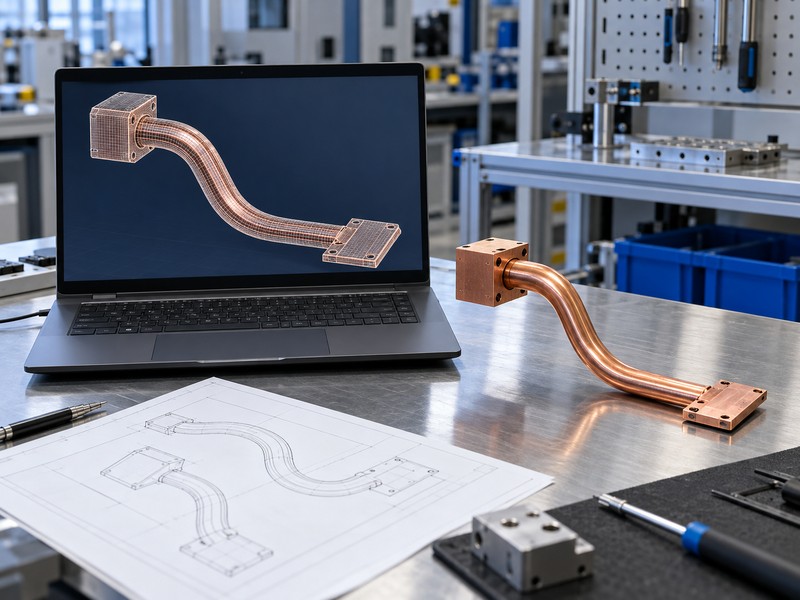
Use heat pipe thermal conductivity in simulation only when the equivalent model preserves the measured thermal direction, geometry, and boundaries. A high axial value assigned to an entire solid block can incorrectly permit equally strong transverse spreading. A scalar material replacement may also hide evaporator and condenser contact effects. Choose a resistance network, directional conductivity model, or a dedicated two-phase representation that suits the engineering question.
What should you validate before trusting the model?
Compare predicted sensor temperatures with the physical test at the same load and cooling conditions. Keep separately modeled contact resistance outside a conductivity value that already includes it to avoid double counting. For multiple pipes, check whether source and condenser load sharing are represented. Validate more than one operating point if the model will support decisions across a broad load range.
- Match the effective length and reference area conventions.
- Distinguish axial transport from transverse conduction.
- Define the approved range for fitted model inputs.
| Modeling choice | Check required |
|---|---|
| Equivalent solid | Geometry and direction match the data |
| Resistance network | Contact boundaries avoid double counting |
| Two-phase model | Construction and boundary inputs are supported |
Approve the model for its demonstrated use range and revisit it when forming, interfaces, or cooling conditions change.
10. What should a supplier comparison include?
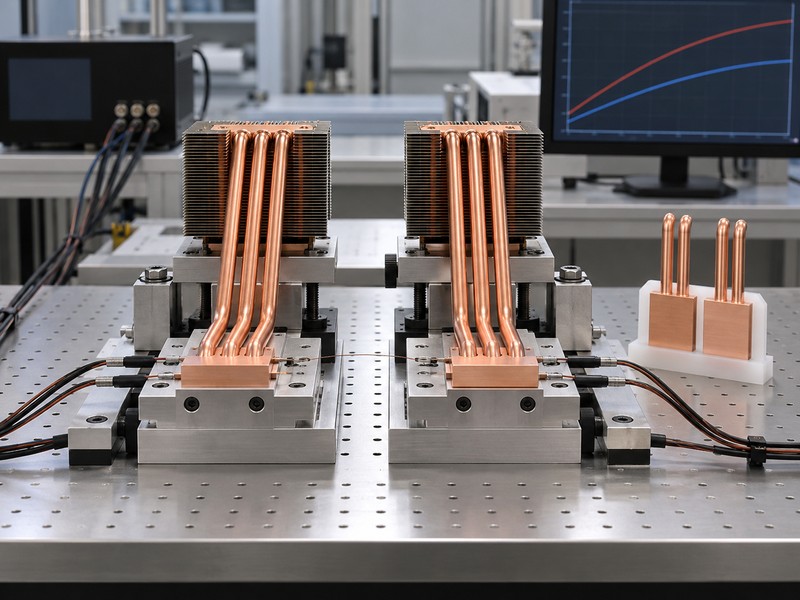
A supplier comparison should pair heat pipe thermal conductivity with resistance, dimensions, measurement definitions, and operating conditions. Request the raw inputs behind each calculation. For the earlier hypothetical 4 K difference, an assumed ±0.4 K difference uncertainty alone would represent a 10 percent relative uncertainty contribution before power and geometry effects. Small measured gradients require careful measurement rather than extra reported decimal places.
What belongs in the acceptance request?
Give each supplier the same drawing, source contact, condenser boundary, and installation positions. Ask for net heat flow, sensor layout, stabilization rule, and uncertainty assessment. Define which changes require review after approval. Keep published maximum values separate from the evidence that supports your exact operating point.
- Request resistance and conductivity together.
- Require explicit length, area, and temperature conventions.
- Preserve formed-part identification and test records.
| Comparison field | Required agreement |
|---|---|
| Geometry | Finished part and reference conventions |
| Operating point | Load, temperature, orientation, cooling |
| Measurement | Boundaries, loss corrections, uncertainty |
Evaluate a quoted value only after its calculation can be reproduced from the supplied test definitions.
FAQ
Q1. Can I use one conductivity value for every pipe length?
No. Effective conductivity contains a length convention, and physical resistance and transport limits also change with geometry.
Q2. What is the best number for comparing suppliers?
Use measured resistance at matched operating conditions, with the same temperature boundaries and the associated transport margin.
Q3. How do I know which area a supplier used?
Ask for its equation and dimensions. External envelope, vapor-core, and wall areas produce different calculated values.
Q4. Can a smaller pipe report a higher conductivity?
Yes. Area normalization can raise its effective value without proving it transports more heat or gives a lower temperature rise.
Q5. Does a low wall-temperature difference prove my chip is cool?
No. Package, interface, contact, fin, and cooling-medium resistances can still raise the chip temperature.
Send your formed drawing, source footprint, cooling boundary, and temperature target when you ask Morton to review your thermal requirement.